top of page
Robyn Bayland
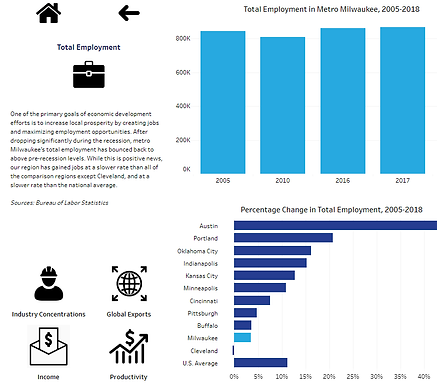
DATA VISUALIZATION | Wisconsin Policy Forum: Innovation Data Tool (2019)
During my stint at a nonpartisan think tank, I spent a lot of time collaborating with senior researchers to build interactive data dashboards in Tableau. This one looks at how Milwaukee compares to similarly-sized metro areas on tech innovation.
bottom of page